背景:來自一位Nantou.py社員的問題,經由Nantou.py大家庭,大家相互討論,以共學方式共同解決該問題。
LINE群組:https://line.me/R/ti/g/YX6mi3AUqc
臉書群組:https://www.facebook.com/groups/Nantou.py/
問題:能否把兩個下拉式表單放在同一畫面,並能操作。
程式碼:
1 2 3 4 5 6 7 8 9 10 11 12 13 14 15 16 17 18 19 20 21 22 23 24 25 26 27 28 29 30 31 32 33 34 35 36 37 38 39 40 41 42 43 44 45 46 47 48 49 50 51 52 53 54 55 56 57 58 59 60 61 62 63 64 65 66 67 68 | from bokeh.models import ColumnDataSource from bokeh.plotting import figure, output_file, show, output_notebook, gridplot from bokeh.models.widgets import Select from bokeh.io import curdoc from bokeh.layouts import column, row import pandas as pd #第一個圖的資料 d1 = {'time': [1,2,3,4], 'y': [2,4,6,8]} d2 = {'time': [1,2,3,4,5], 'y': [2,1,1,8,22]} df1 = pd.DataFrame(data=d1, ) df2 = pd.DataFrame(data=d2, ) source = ColumnDataSource(df1 ) p = figure() r = p.vbar(x='time', top='y', width=1, source = source) #第一個下拉選單 select = Select(title="monthly csv-s", options=['d1', 'd2']) #第一個下拉選單的callback def update_plot(attrname, old, new): if select.value == 'd1': newSource = df1 if select.value == 'd2': newSource = df2 source.data = newSource #第一個下拉選單動作 select.on_change('value', update_plot) layout1 = column(row(select, width=400), p) #curdoc().add_root(layout) #第二個圖的資料 d3 = {'time': [1,2,3,4], 'y': [8,6,4,2]} d4 = {'time': [1,2,3,4,5], 'y': [22,8,1,1,2]} df3 = pd.DataFrame(data=d3, ) df4 = pd.DataFrame(data=d4, ) source2 = ColumnDataSource(df3 ) p2 = figure() r1 = p2.vbar(x='time', top='y', width=1, source = source2) #第二個下拉選單 select2 = Select(title="monthly csv-s2", options=['d3', 'd4']) #第二個下拉選單的callback def update_plot2(attrname, old, new): if select2.value == 'd3': newSource2 = df3 if select2.value == 'd4': newSource2 = df4 source2.data = newSource2 #第二個下拉選單動作 select2.on_change('value', update_plot2) layout2 = column(row(select2, width=400), p2) #把第一個圖表和第二個圖表組合起來 layout3 = gridplot([[layout1, layout2]], toolbar_location=None) #安排畫面 curdoc().add_root(layout3) |
以上程式儲存在test.py
執行指令為
bokeh serve --show test.py
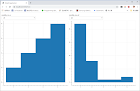
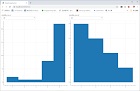
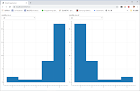
執行畫面:
沒有留言:
張貼留言